Flat 50% OFF sitewide!
NOW & ON BLACK FRIDAY!




Diamond Table And Depth Chart By Shape: A Complete Guide
Diamond table and depth percentages can be useful in understanding how proportions impact a diamond's light behaviour, appearance, and face-up size. However, the best proportions of a diamond are dependent on its shape and facet style. Knowing what a diamond table and depth chart are will make it easy for you to compare diamonds using their grading certificates.
Table of Content
- What Is a Diamond's Table?
- What Is a Diamond's Depth?
- How to Calculate Table and Depth Percentages
- Diamond Table and Depth Chart by Shape
- What Is the Best Table and Depth Percentage for Diamonds?
- How Depth Affects Face-Up Size
- How to Use a Diamond Table and Depth Chart When Purchasing
- Conclusion
What Is a Diamond's Table?
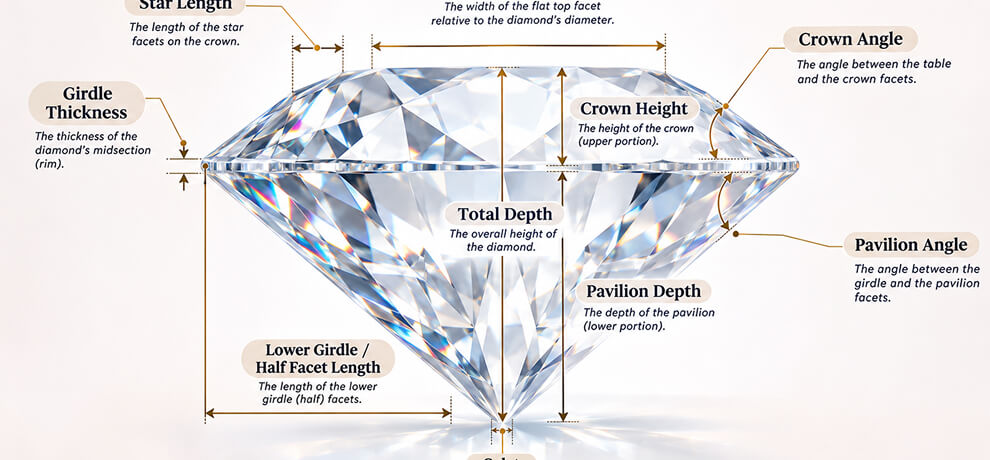
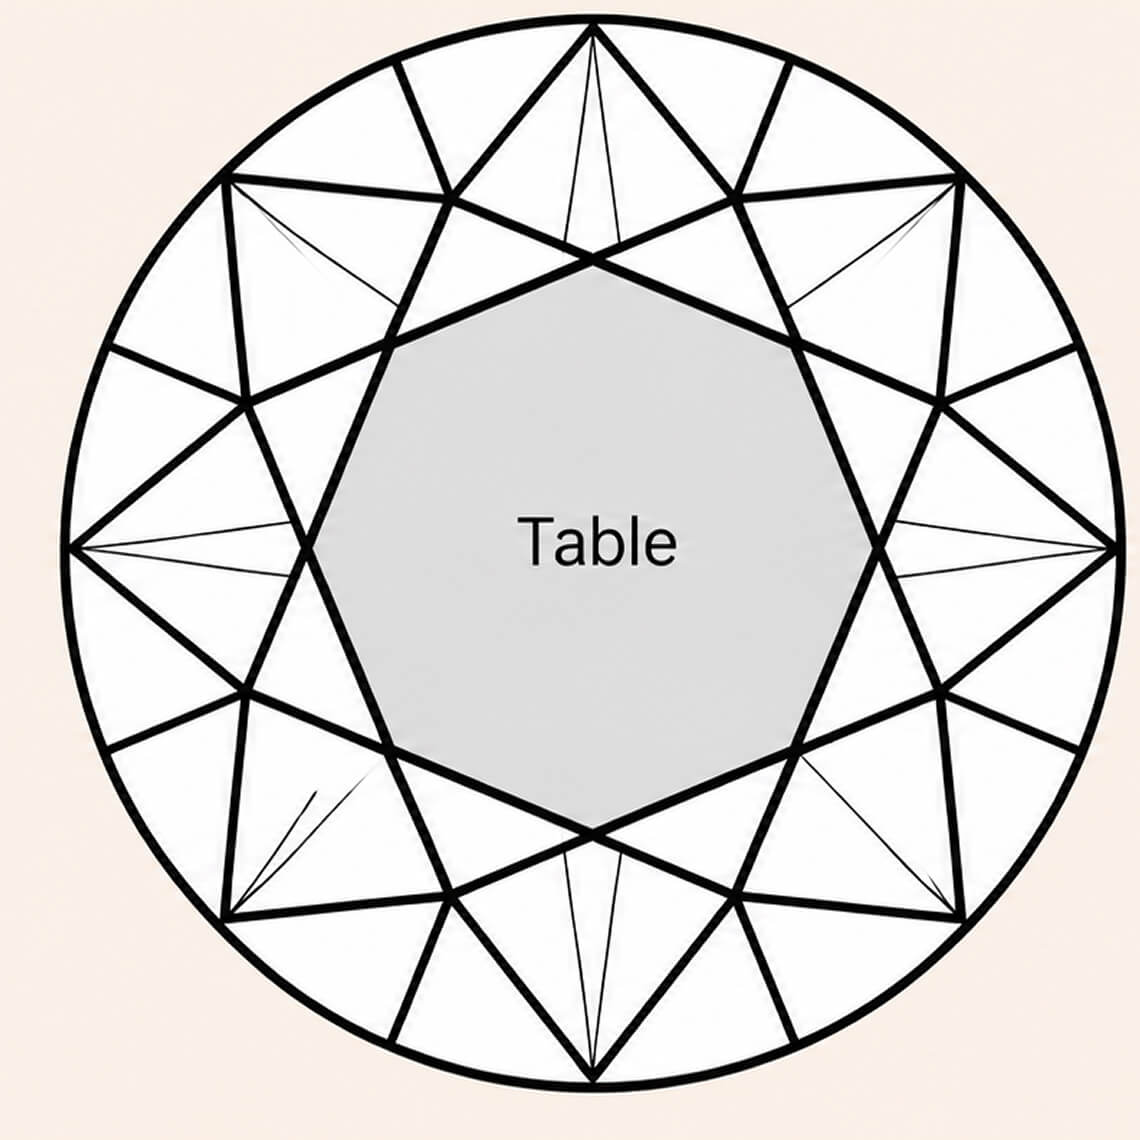
A diamond's table refers to the large, flattened surface cut at the top of the diamond that appears when viewing the diamond from above. It is the largest facet in a traditional round diamond cut, forming part of the way light passes into and through the diamond. Table percentage is calculated by dividing the table width by the average girdle diameter and multiplying by 100.
For instance, a diamond table percentage of 56% implies that the width of the table is 56% of the diamond’s average girdle diameter. Having a larger table increases visibility of the middle facet, whereas having a smaller table leaves room for the outer crown facets. Neither is preferred per se, but it has to fit other diamond proportions such as the crown, pavilion, etc., in order to create desired brightness, fire, and scintillation.
What Is a Diamond's Depth?
The depth of a diamond is the distance from the table of the diamond to the culet or the bottom of the pavilion, depending on the diamond’s cut. The depth percentage of a diamond can be defined as the depth of a diamond relative to its width or average girdle diameter, depending on its type.
The depth of a diamond has an influence on the visibility of the diamond from above. A diamond with too much depth will have more of its weight below the girdle and will look smaller compared to another diamond with the same carat weight but different proportions. A stone that’s too shallow lets light escape through the bottom, which can create a glassy, see-through centre known as windowing.
The goal is to achieve a proper balance between light reflection and the appearance of the diamond.
How to Calculate Table and Depth Percentages
Both percentages can be calculated based on the dimensions given in a diamond grading report.
Table percentage: Table width ÷ diamond width × 100
Depth percentage: Total depth ÷ diamond width × 100
For a round brilliant diamond, the average diameter of its girdle will be used. In the case of a fancy-shaped diamond, the dimensions and grading system have to be interpreted in relation to the diamond's outline. For example, if a round brilliant diamond has an average girdle diameter of 6.0 mm and a table dimension of 3.36 mm, then the table percentage will be 56%.
The total depth of this diamond is 3.66 mm; its depth percentage will be 61%. This gives you an idea about the proportion of the diamond, but does not define its quality of cut.
Diamond Table and Depth Chart by Shape
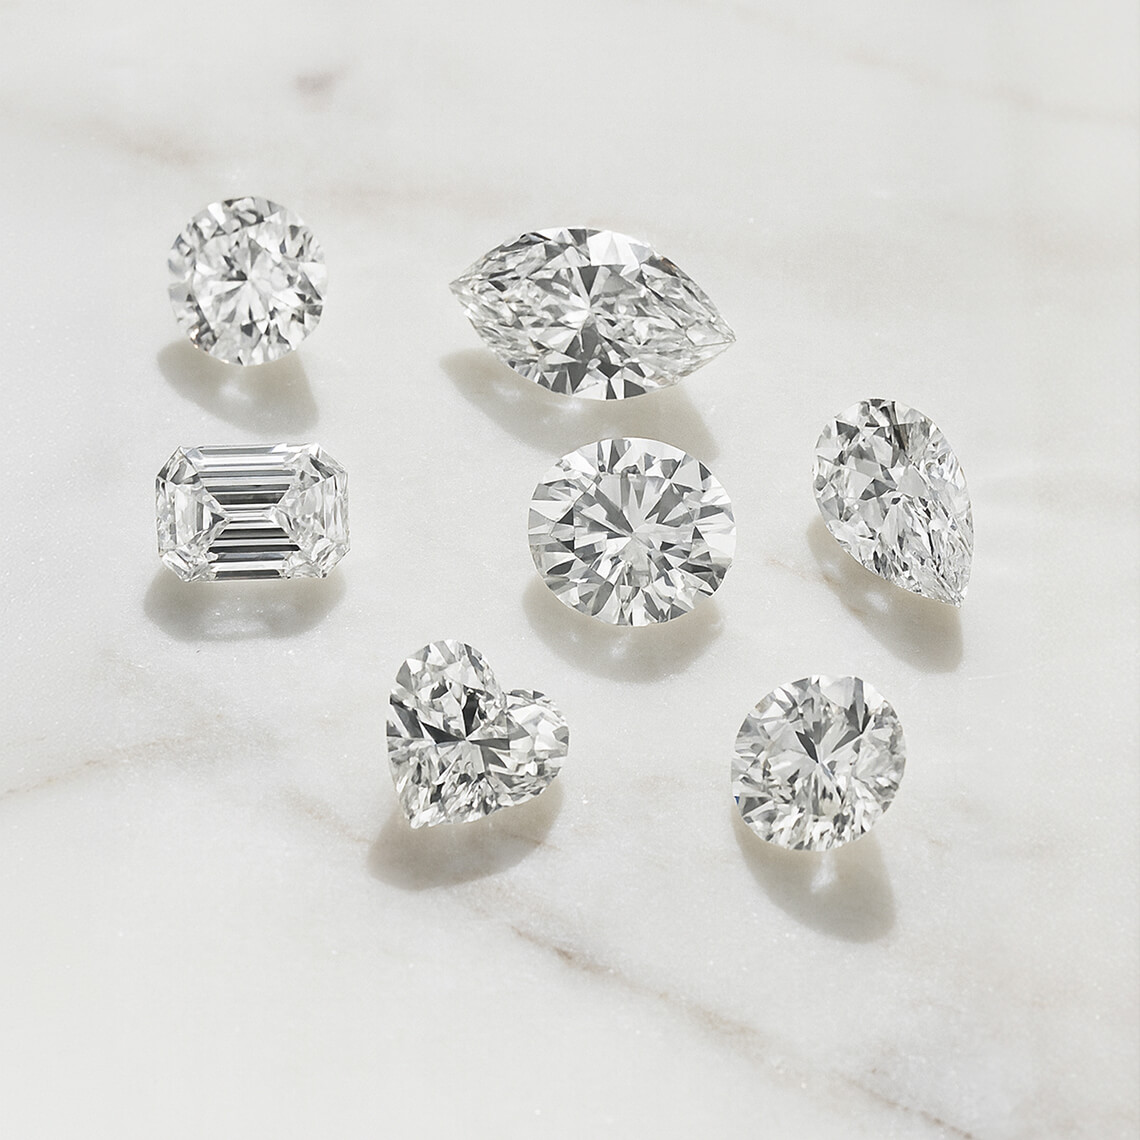
The diamond depth chart below offers some guidance as to the ideal diamond proportions that should be used for nine different diamond shapes. These numbers serve only as a general guide to begin with when comparing diamonds, and not as an exact definition of ideal cut.
|
Diamond Shape |
Table Percentage |
Depth Percentage |
|
Round Brilliant |
53% - 58% |
59% - 62.3% |
|
Oval |
53% - 63% |
58% - 62% |
|
Princess |
67% - 72% |
64% - 75% |
|
Emerald |
61% - 69% |
61% - 67% |
|
Pear |
53% - 63% |
58% - 62% |
|
Marquise |
53% - 63% |
58% - 62% |
|
Radiant |
61% - 69% |
61% - 67% |
|
Cushion |
61% - 67% |
61% - 67% |
|
Heart |
53% - 63% |
58% - 62% |
Round Brilliant
Round brilliants have the most well-established grading system of cut diamonds. A table size of 53%-58% and a depth of 59%-62.3% can give a good starting point for comparison. Still, crown angles, pavilion angles, and other parameters need to be considered as well.
Oval
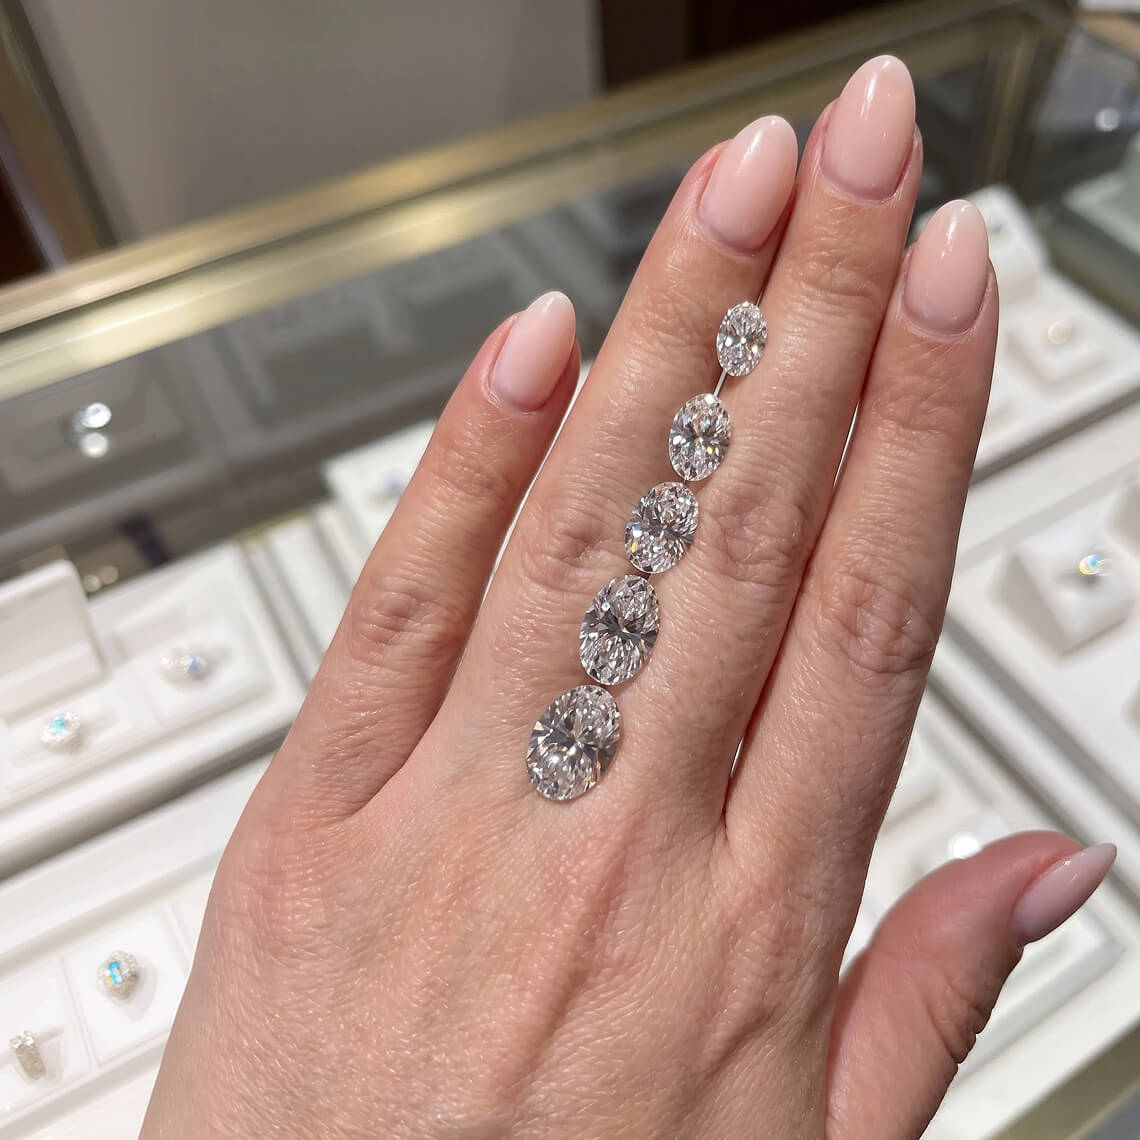
The oval-shaped diamonds are elongated diamonds with brilliant-cut faceting. The visual characteristics depend on both the proportions and how light falls on the diamond. Evaluate the outline and whether a dark bow-tie shape in the middle is distracting.
Princess
Princess-cut diamonds usually have square outlines and brilliant faceting. They have larger tables and greater depth compared to round brilliants. Make sure that the corners are symmetrical and the stone is visually appealing in all lighting conditions.
Emerald
Step-cut faceting is characteristic of an emerald cut diamond that produces broad flashes instead of the sparkle produced by a brilliant cut. Apart from the table and depth, which should remain balanced to preserve the distinct nature of the gem, transparency, symmetry and light leak are other issues that need consideration.
Pear
This is the shape of diamonds whose one end appears round while the other is pointed. In addition to looking at the depth and table percentage of the diamond, the symmetry of its shoulders and the point should be checked out.
Marquise
These diamonds have an elongated shape with both ends pointed. The length-to-width ratio dictates how slender these gems appear. Their table and depth will describe their proportions.
Radiant
Radiant cut diamonds consist of a rectangular or square shape combined with brilliant cuts. Their proportions depend upon their outline and facet arrangement. Evaluate the brightness, facet arrangement, and face-up proportions of the stone, instead of simply using the chart.
Cushion
The cushion cut diamonds feature rounded corners and can be nearly square or elongated in shape. Different arrangements of their facets create distinctive patterns of light performance. The proportions appropriate for one type of cushion may be incorrect for the other.
Heart
Symmetry is essential when evaluating the heart-shaped diamonds. Both sides of the diamond need to look equal, and there must be a good cleft and point of the diamond. Table and depth percentages can provide helpful information.
What Is the Best Table and Depth Percentage for Diamonds?
No specific table and depth percentage will make sure that a diamond has an outstanding appearance. The correct proportions for each diamond depend on its shape, facet pattern, and proportionality.
The larger table modifies the ratio between the central facet and the other facets in the crown section. Depending on the other proportions, this affects the light performance of a diamond. The smaller table changes the ratio differently.
The depth also impacts the performance of light and the overall diameter of a diamond. An excessive depth hides a portion of the diamond weight under the girdle, while an inadequate depth loses light through the pavilion.
For round brilliant diamonds, there are existing grading cut systems that analyse multiple measurements. There is no universal cut grading system for fancy-shaped diamonds, which makes published proportions a guideline only.
How Table and Depth Affect Diamond Sparkle
There are three elements of diamond sparkle:
-
Brightness: the reflection of white light.
-
Fire: dispersion of the white light into flashes of different colours.
-
Scintillation: the dark and bright patches and flashes that you see when you move the stone or light source
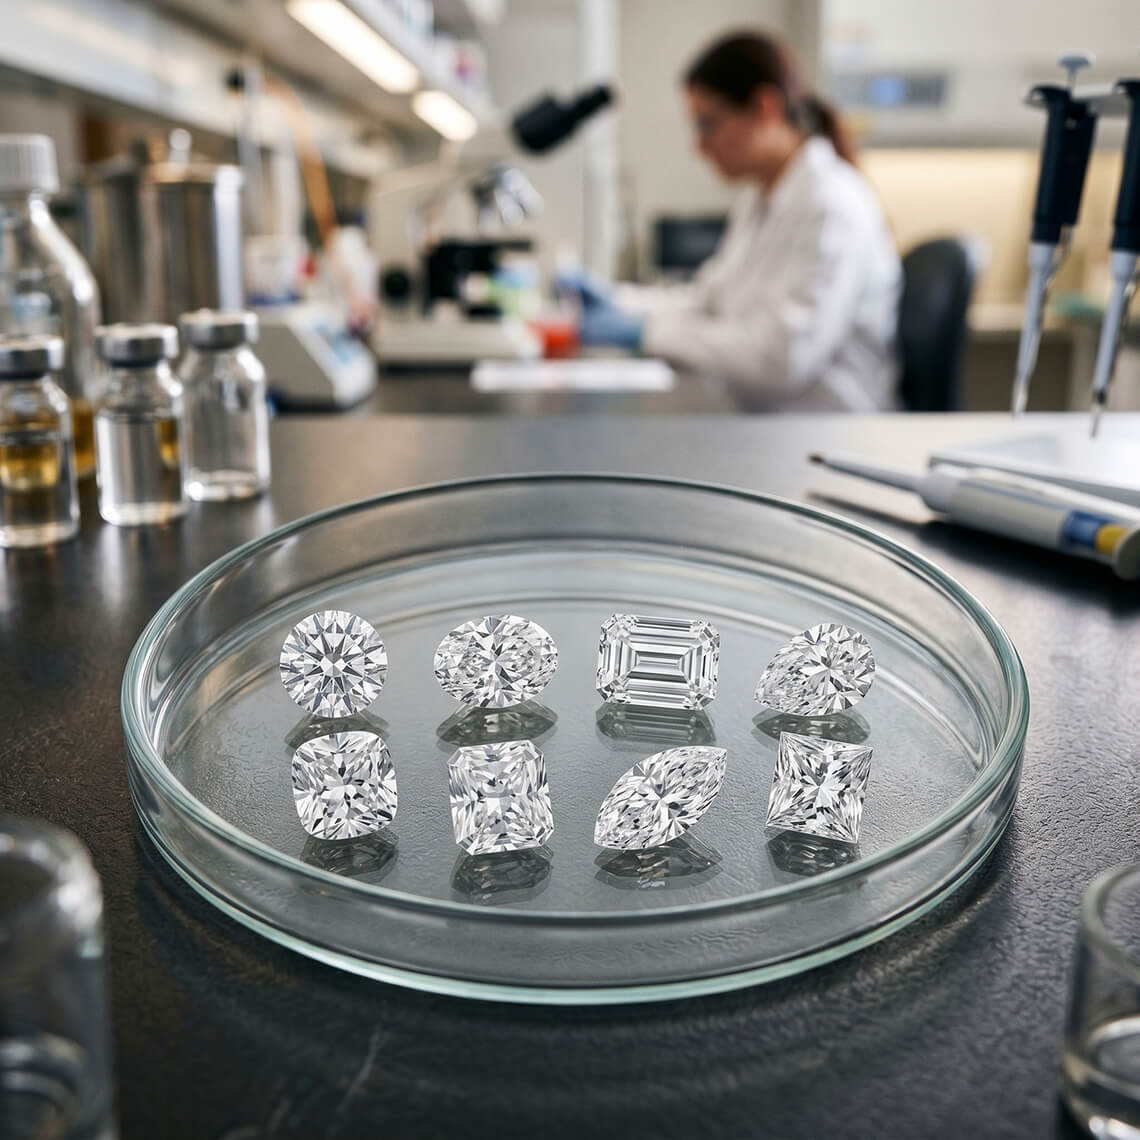
The table and depth affect the interaction of light with a diamond's facets, depending on other proportions of the stone.
Why proportions must be assessed together?
A diamond can have appropriate measurements of table and depth but could be poorly distributed when it comes to the distribution of light and have a distracting dark spot or poor-looking facet pattern.
This is especially true for fancy cuts since their silhouette and facet arrangement result in different optical performance. For instance, an oval cut with a prominent bow tie effect should be evaluated on the basis of how it performs in motion.
How to Use a Diamond Table and Depth Chart When Purchasing
Compare Similar Shapes and Cuts
Use the chart to help you narrow down your options, but compare diamonds of the same shape and similar cutting styles. A good table percentage for a princess cut might not be a good choice for an emerald cut.
Review the Grading Report
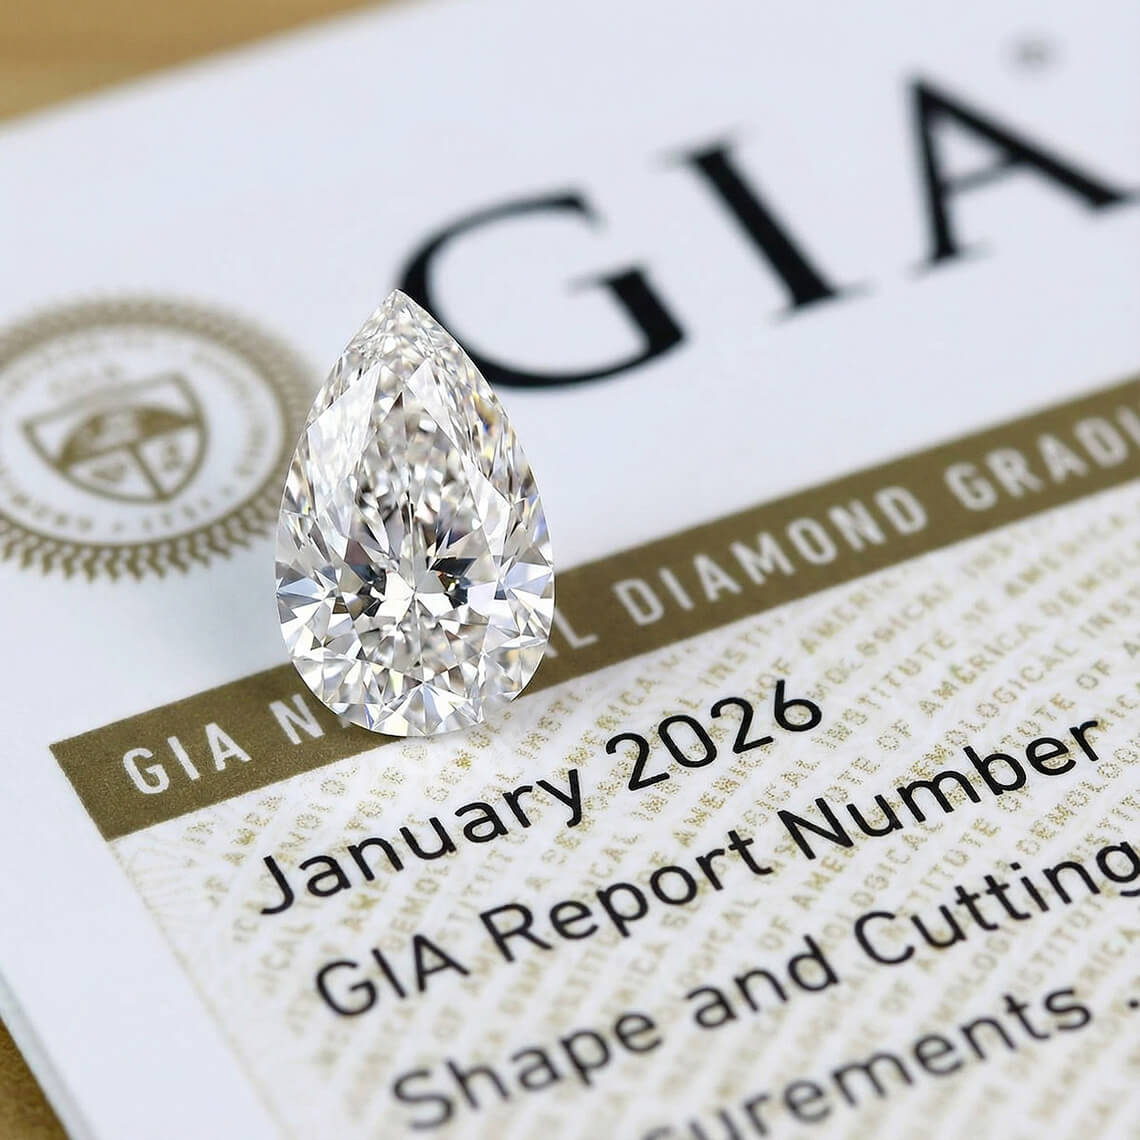
Look at the table, depth, measurements, symmetry, and polish on the report. In cases where a cut grade is given, consider the cut grade of a typical round brilliant diamond. Remember that a diamond report gives information about proportions, not how the diamond looks.
Assess Actual Light Performance and Appearance
Look at the diamond face-up and, when possible, under different lighting conditions. Look for even brightness, nice flashes, a good outline, and any dark areas or light leakage. For fancy shapes, consider symmetry and light performance. Consider the length and width in millimetres to get an idea of the face-up size of the diamond.
Conclusion
While the table and depth percentages of a diamond provide valuable information about the proportions of a diamond, they do not give the complete picture of its cut quality. The diamond table and diamond depth chart will be helpful for comparing diamonds of the same shape, while facets, symmetry, polish, and light performance will allow evaluating the appearance of the stones.
The diamond depth chart should serve as a guide but not as an absolute standard, and the measurements of the diamond along with its grading report should be considered. At Friendly Diamonds, we compare the available characteristics and evaluate the appearance of the stones.
FAQs
Is a larger diamond table better?
Can a deeper diamond appear smaller?
Can a diamond have ideal table and depth percentages and yet lack sparkle?
Do oval and cushion cuts have ideal cut proportions?